

04 December 2020
Estimated reading time: 04 minutes
04 December 2020
The controversy surrounding the rule of law – and its dangerous slippage in key European Union member states – is on the minds of every EU policymakers. Should countries that violate core standards of democracy – such as the independence of the judiciary or the freedom of the press – be the recipients of large amounts of EU aide – much of it coming from funds borrowed today that will have to be repaid by generations tomorrow? Or should the €672 billion Next Generation European Union budget be used not just to help countries recover from a devastating pandemic but also to force them to re-commit to the very values that brought European countries together in the first place?
As always, a good place to begin is with a review of the evidence, and that’s exactly what the European Commission has done. The 2020 Rule of Law Report, brought out by the European Commission in November 2020, reviews the commitment to rule of law in all 27 EU member states, casting the net far wider than it is usually case and setting the report up to play a key role as a transparency, compliance and enforcement tool.
The media sometimes casts the debate around a binary definition of the rule of law: is a country compliant or not? But the reality is far more diverse and interesting. The report shows clearly that every EU member state can improve compliance with the rule of law. Even more importantly, the report sets out an implicit vision of democracy in three areas where compliance is most important and most effective: an independent and well-functioning justice system; strong anticorruption measures effective at limiting corruption and media freedom and independence.
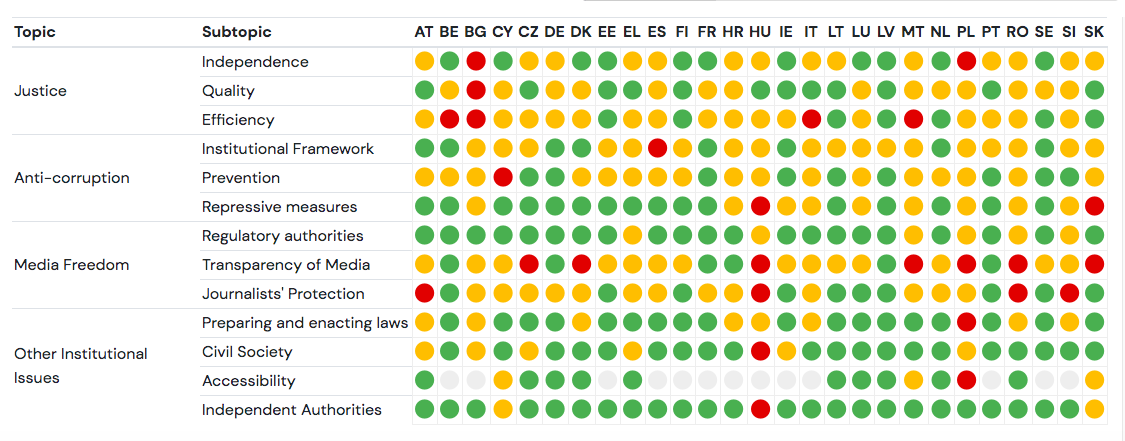
Yet both this vision and the details are hard to appreciate in the 500 pages of the report and 27 country annexes. This is why the Lisbon Council built the Rule of Law Dashboard, an interactive visualisation tool to bring transparency, insight and ease of comparative assessment to all European governments. With the Rule of Law Dashboard, you can:
The Rule of Law Dashboard includes detailed country profiles for all 27 member states based on the European Commission’s assessment. The dashboard lets you move from the full picture to the details of the single paragraph in a couple of clicks.
The purpose is not to create rankings but to make hundreds of pages of country reports readable and to provide a simple overview of the findings. In this single word – simple – lies the main challenge. How do you make complex information accessible without oversimplifying the message? The original source is not easy to summarise:
In this context, the Lisbon Council chose to build on this already very promising start with a visual, traffic light dashboard. Because information is qualitative and inhomogeneous, it is not possible to obtain linear indicators such as percentages that can easily translate in different shades of intensity. Traffic light dots instead provide sufficient flexibility to summarize qualitative information.
Concretely, the team analysed each paragraph of the country reports consistent with the European Semester methodology. Every first sentence has been associated with a colour, based on its content, and with a “subtopic”, as described in the methodology. When there are several paragraph for a subtopic, the colour code is calculated by a simple arithmetic average between the values (one being red, three being green). Each dot in the dashboard summarizes typically several paragraphs. More details are available in the dashboard methodology and a more theoretical analysis of the approach is published in chapter 8 of Governance Indicators: Approaches, Progress and Promise, a book published recently Oxford University Press.
As with any visualisation, there are obvious limitations that we had to manage.
But the most important measure to address the shortcomings is full transparency. This is a tool to empower readers to make their own informed judgments. To this end:
The result, apparently, is effective, judging by the many complimentary tweets and emails, the coverage in the news, and the level of attention dedicated: the dashboard had 5.000 unique users in its first two days.
We do not know whether the rule of law will eventually become a condition to access the Next Generation European Union fund. But we do know that it will be the condition for the health of our democracies and for the future of Europe. And we will all have to do our part in cultivating and protecting it.
David Osimo is director of research at the Lisbon Council.
Download04 December 2020
Estimated reading time: 04 minutes